A) B + D.
B) C + D.
C) A + C.
D) C.
F) All of the above
Correct Answer

verified
Correct Answer
verified
True/False
The supply of tickets to a major sporting event held in an enclosed stadium with a fixed number of seats, such as the Super Bowl or a World Series game, is perfectly inelastic.
B) False
Correct Answer

verified
Correct Answer
verified
Multiple Choice
We use percentage changes in the formula for estimating the price elasticity of demand coefficient in order to
A) make the coefficient's value become independent of whether price goes up or down.
B) take the midpoints of P and of Q in the computation.
C) eliminate the negative sign of the coefficient.
D) make it irrelevant how we measure price: be it in cents, in dollars, or in thousands of dollars.
F) B) and C)
Correct Answer

verified
Correct Answer
verified
Multiple Choice
 Refer to the table. Over the $6-$4 price range, supply is
A) perfectly elastic.
B) elastic.
C) perfectly inelastic.
D) inelastic.
F) B) and C)
Correct Answer

verified
Correct Answer
verified
Multiple Choice
A supply curve that is parallel to the horizontal axis suggests that
A) the industry is organized monopolistically.
B) the relationship between price and quantity supplied is inverse.
C) a change in demand will change price in the same direction.
D) a change in demand will change the equilibrium quantity but not price.
F) B) and D)
Correct Answer

verified
Correct Answer
verified
Multiple Choice

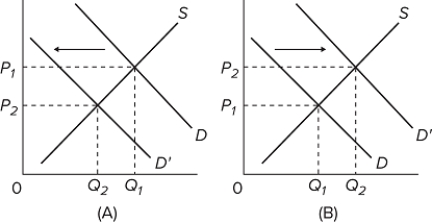
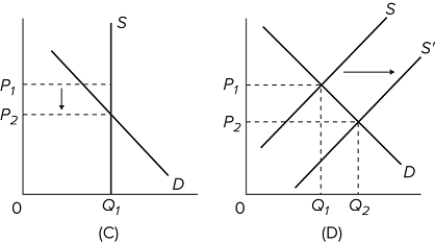
 Refer to the above graphs. For which graph is the supply perfectly inelastic?
A) graph A
B) graph B
C) graph C
D) graph D
F) None of the above
Correct Answer

verified
Correct Answer
verified
Multiple Choice
It takes a considerable amount of time to increase the production of pork. This implies that
A) a change in the demand for pork will not affect its price in the short run.
B) the short-run supply curve for pork is less elastic than the long-run supply curve for pork.
C) an increase in the demand for pork will elicit a larger supply response in the short run than in the long run.
D) the long-run supply curve for pork is less elastic than the short-run supply curve for pork.
F) C) and D)
Correct Answer

verified
Correct Answer
verified
Multiple Choice
Suppose that as the price of Y falls from $12 to $10, the quantity of Y demanded increases from 500 to 600. Then the absolute value of the price elasticity (using the midpoint formula) is approximately
A) 50.
B) 1.2.
C) 1.
D) 0.83.
F) B) and D)
Correct Answer

verified
Correct Answer
verified
Multiple Choice
When the price of a product is increased 8 percent, the quantity demanded decreases 20 percent. The price-elasticity of demand coefficient for this product is
A) 2.5.
B) 25.
C) 0.4.
D) 4.
F) None of the above
Correct Answer

verified
Correct Answer
verified
Multiple Choice
Which of the following statements is not correct?
A) If the relative change in price is greater than the relative change in the quantity demanded associated with it, demand is inelastic.
B) In the range of prices in which demand is elastic, total revenue will diminish as price decreases.
C) Total revenue will not change if price varies within a range where the elasticity coefficient is unity.
D) Demand tends to be elastic at high prices and inelastic at low prices.
F) B) and C)
Correct Answer

verified
Correct Answer
verified
Multiple Choice
Blossom, Inc., sells 500 bottles of perfume a month when the price is $7. A huge increase in resource costs forces Blossom to raise the price to $9, and the firm only manages to sell 460 bottles of perfume. Using the midpoint formula, the price elasticity of demand coefficient is
A) 0.33 and elastic.
B) 3 and elastic.
C) 0.33 and inelastic.
D) 3 and inelastic.
F) B) and C)
Correct Answer

verified
Correct Answer
verified
Multiple Choice
Chuck has a price elasticity of demand for beer of 1.2. Suppose that the price of beer is increased by 10 percent. What will happen to the total amount Chuck spends on beer?
A) It will not change.
B) It will decrease.
C) It will increase.
D) It is impossible to tell.
F) All of the above
Correct Answer

verified
Correct Answer
verified
Multiple Choice
Suppose you are given the following data on demand for a product. The price elasticity of demand (based on the midpoint formula) when price decreases from $9 to $7 is 
A) 0.63.
B) 1.16.
C) 1.6.
D) 2.27.
F) B) and C)
Correct Answer

verified
Correct Answer
verified
True/False
We would expect the cross-elasticity of demand between popcorn and potato chips to be negative.
B) False
Correct Answer

verified
Correct Answer
verified
Multiple Choice
If the price elasticity of demand for a product is unity, a decrease in price will
A) have no effect upon the amount purchased.
B) increase the quantity demanded and increase total revenue.
C) increase the quantity demanded but decrease total revenue.
D) increase the quantity demanded, but total revenue will be unchanged.
F) All of the above
Correct Answer

verified
Correct Answer
verified
Multiple Choice
 Refer to the information. Over the $11-$9 price range, demand is
A) perfectly elastic.
B) perfectly inelastic.
C) elastic.
D) inelastic.
F) C) and D)
Correct Answer

verified
Correct Answer
verified
Multiple Choice
Answer the question based on the following table, which shows a demand schedule.  At a price of $2, the total revenues of sellers will be
A) $21.
B) $17.
C) $38.
D) $9.5.
F) A) and B)
Correct Answer

verified
Correct Answer
verified
Multiple Choice
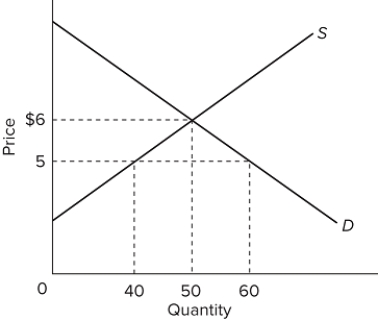
 Refer to the figure above. At the equilibrium point in this market, the sellers' total revenues are equal to
A) $300.
B) $50.
C) $360.
D) $150.
F) None of the above
Correct Answer

verified
Correct Answer
verified
Multiple Choice
Answer the question based on the following data.  Over which of the following price ranges is the demand elastic?
A) $12-$10
B) $8-$6
C) $10-$8
D) $14-$12
F) All of the above
Correct Answer

verified
Correct Answer
verified
Multiple Choice
The supply of cars will be more elastic the
A) greater the quantity demanded.
B) longer the time interval considered.
C) greater the decline in input prices.
D) less able producers are to make other goods.
F) B) and D)
Correct Answer

verified
Correct Answer
verified
Showing 101 - 120 of 399
Related Exams