Filters
Question type
The figure below shows Sue's and Carlos' demand curves for gasoline. It would be useful to find the equation of the demand curves to answer the questions below.
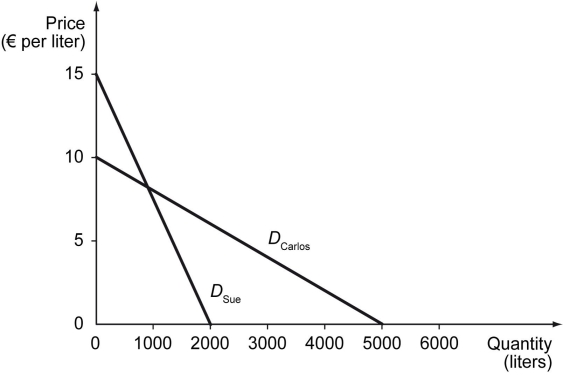 -Refer to the figure above.If the price of gasoline is 3.00 euros per liter,the total quantity of gasoline demanded is ________ liters.
A) 1,600
B) 2,400
C) 4,300
D) 5,100
E) A) and C)
F) None of the above
F) None of the above
Correct Answer

verified
Correct Answer
verified
The following figure shows the demand curves for pens for two consumers.
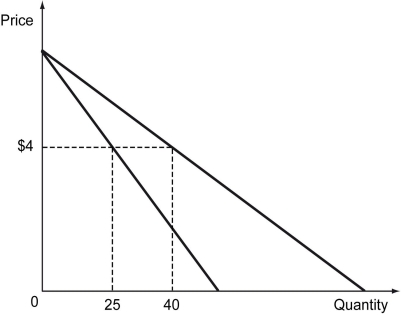 Assuming that the market consists of only these two consumers,what is the market demand for pens when the price is $4?
A) 15 units
B) 25 units
C) 40 units
D) 65 units
E) B) and D)
F) A) and D)
F) A) and D)
Correct Answer
verified
Correct Answer
verified