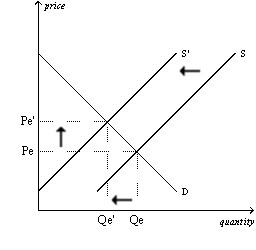
A) a decrease in demand and a decrease in quantity supplied
B) a decrease in demand and a decrease in supply
C) a decrease in quantity demanded and a decrease in quantity supplied
D) a decrease in quantity demanded and a decrease in supply
F) A) and D)
Correct Answer

verified
Correct Answer
verified
Multiple Choice
Warrensburg is a small college town in Missouri.At the end of August each year,the market demand for fast food in Warrensburg
A) increases.
B) decreases.
C) remains constant,but we observe a movement downward and to the right along the demand curve.
D) remains constant,but we observe a movement upward and to the left along the demand curve.
F) B) and D)
Correct Answer

verified
Correct Answer
verified
Multiple Choice
The sum of all the individual demand curves for a product is called
A) total demand.
B) consumer demand.
C) aggregate demand.
D) market demand.
F) C) and D)
Correct Answer

verified
Correct Answer
verified
Multiple Choice
Suppose the incomes of buyers in a market for a particular normal good decrease and there is also a reduction in input prices.What would we expect to occur in this market?
A) Equilibrium price would decrease,but the impact on equilibrium quantity would be ambiguous.
B) Equilibrium price would increase,but the impact on equilibrium quantity would be ambiguous.
C) Equilibrium quantity would decrease,but the impact on equilibrium price would be ambiguous.
D) Equilibrium quantity would increase,but the impact on equilibrium price would be ambiguous.
F) A) and B)
Correct Answer

verified
Correct Answer
verified
True/False
If the demand for a good falls when income falls,then the good is called an inferior good.
B) False
Correct Answer

verified
Correct Answer
verified
Multiple Choice
Which of the following events would definitely result in a higher price in the market for Snickers?
A) Demand for Snickers increases and supply of Snickers decreases.
B) Demand for Snickers and supply of Snickers both decrease.
C) Demand for Snickers decreases and supply of Snickers increases.
D) Demand for Snickers and supply of Snickers both increase
F) B) and D)
Correct Answer

verified
Correct Answer
verified
Multiple Choice
A movement upward and to the left along a demand curve is called
A) an increase in demand.
B) a decrease in demand.
C) a decrease in quantity demanded.
D) an increase in quantity demanded.
F) A) and C)
Correct Answer

verified
Correct Answer
verified
Multiple Choice
Figure 4-6 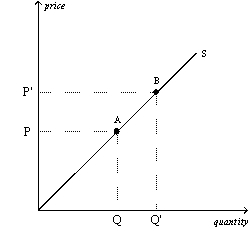 -Refer to Figure 4-6.The movement from point A to point B on the graph represents
A) an increased willingness and ability on the part of suppliers to supply the good at each possible price.
B) an increase in the number of suppliers.
C) a decrease in the price of a relevant input.
D) an increase in the price of the good that is being supplied and suppliers' response to that price change.
F) B) and D)
Correct Answer

verified
Correct Answer
verified
Multiple Choice
Two goods are substitutes when a decrease in the price of one good
A) decreases the demand for the other good.
B) decreases the quantity demanded of the other good.
C) increases the demand for the other good.
D) increases the quantity demanded of the other good.
F) All of the above
Correct Answer

verified
Correct Answer
verified
Multiple Choice
Suppose that demand for a good decreases and,at the same time,supply of the good decreases.What would happen in the market for the good?
A) Equilibrium price would decrease,but the impact on equilibrium quantity would be ambiguous.
B) Equilibrium price would increase,but the impact on equilibrium quantity would be ambiguous.
C) Equilibrium quantity would decrease,but the impact on equilibrium price would be ambiguous.
D) Equilibrium quantity would increase,but the impact on equilibrium price would be ambiguous.
F) A) and D)
Correct Answer

verified
Correct Answer
verified
Multiple Choice
The dictionary defines equilibrium as a situation in which forces
A) are in balance.
B) are the same.
C) clash.
D) remain constant.
F) A) and B)
Correct Answer

verified
Correct Answer
verified
Multiple Choice
Suppose Spencer and Kate are the only two demanders of lemonade.Each month,Spencer buys six glasses of lemonade when the price is $1.00 per glass,and he buys four glasses when the price is $1.50 per glass.Each month,Kate buys four glasses of lemonade when the price is $1.00 per glass,and she buys two glasses when the price is $1.50 per glass.Which of the following points is on the market demand curve?
A) (quantity demanded = 2,price = $1.50)
B) (quantity demanded = 4,price = $2.50)
C) (quantity demanded = 10,price = $1.00)
D) (quantity demanded = 16,price = $2.50)
F) A) and D)
Correct Answer

verified
Correct Answer
verified
Multiple Choice
Suppose that when income rises,the demand curve for computers shifts to the right.In this case,we know computers are
A) inferior goods.
B) normal goods.
C) perfectly competitive goods.
D) durable goods.
F) A) and C)
Correct Answer

verified
Correct Answer
verified
Multiple Choice
Figure 4-14
Panel (a) Panel (b) 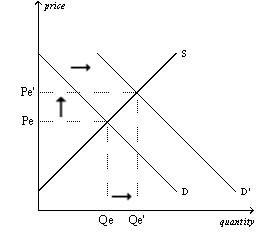
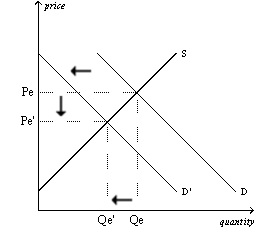 Panel (c) Panel (d)
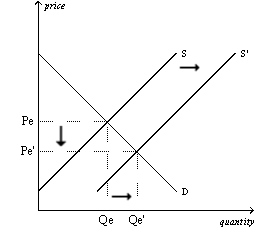
 -Refer to Figure 4-14.Which of the four panels illustrates a decrease in quantity supplied?
A) Panel (a)
B) Panel (b)
C) Panel (c)
D) Panel (d)
F) All of the above
Correct Answer

verified
Correct Answer
verified
Multiple Choice
Which of the following events could shift the demand curve for gasoline to the left?
A) The income of gasoline buyers rises,and gasoline is a normal good.
B) The income of gasoline buyers falls,and gasoline is an inferior good.
C) Public service announcements run on television encourage people to walk or ride bicycles instead of driving cars.
D) The price of gasoline rises.
F) C) and D)
Correct Answer

verified
Correct Answer
verified
Multiple Choice
You wear either shorts or sweatpants every day.You notice that sweatpants have gone on sale,so your demand for
A) sweatpants will increase.
B) sweatpants will decrease.
C) shorts will increase.
D) shorts will decrease.
F) A) and D)
Correct Answer

verified
Correct Answer
verified
Multiple Choice
Figure 4-13
The diagram below pertains to the supply of paper in university markets. 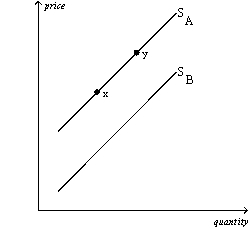 -Refer to Figure 4-13.All else equal,an increase in the use of laptop computers for note-taking would cause a move
A) from x to y.
B) from y to x.
C) from SA to SB.
D) from SB to SA.
F) A) and D)
Correct Answer

verified
Correct Answer
verified
Multiple Choice
An example of a perfectly competitive market would be the
A) cable TV market.
B) soybean market.
C) breakfast cereal market.
D) shampoo market.
F) All of the above
Correct Answer

verified
Correct Answer
verified
Multiple Choice
If goods A and B are complements,then an increase in the price of good A will result in
A) more of good A being sold.
B) more of good B being sold.
C) less of good B being sold.
D) no difference in the quantity sold of either good.
F) C) and D)
Correct Answer

verified
Correct Answer
verified
Multiple Choice
Who gets scarce resources in a market economy?
A) the government
B) whoever the government decides gets them
C) whoever wants them
D) whoever is willing and able to pay the price
F) None of the above
Correct Answer

verified
Correct Answer
verified
Showing 321 - 340 of 467
Related Exams