A) 38%
B) 71%
C) 92%
D) 98%
F) A) and C)
Correct Answer

verified
Correct Answer
verified
True/False
A firm in a monopolistically competitive market can earn short-run profits but not long-run profits.
B) False
Correct Answer

verified
Correct Answer
verified
Multiple Choice
Table 16-1
The following table shows the percentage of output supplied by the top eight firms in four different industries.
 -Refer to Table 16-1. Which industry is the least competitive?
A) Industry A
B) Industry B
C) Industry C
D) Industry D
F) All of the above
Correct Answer

verified
Correct Answer
verified
Multiple Choice
Which of the following best describes the idea of excess capacity in monopolistic competition?
A) Firms produce more output than is socially desirable.
B) The output produced by a typical firm is less than what would occur at the minimum point on its ATC curve.
C) Due to product differentiation, firms choose output levels where price equals average total cost.
D) Firms keep some surplus output on hand in case there is a shift in the demand for their product.
F) A) and C)
Correct Answer

verified
Correct Answer
verified
Multiple Choice
Table 16-7
A monopolistically competitive firm faces the following demand schedule for its product. In addition, the firm has total fixed costs equal to 20.
 -Refer to Table 16-7. If the firm has a constant marginal cost of $7 per unit, how many units should the firm produce to maximize profit?
A) 3 units
B) 4 units
C) 5 units
D) 6 units
F) B) and C)
Correct Answer

verified
Correct Answer
verified
Multiple Choice
The two types of imperfectly competitive markets are
A) markets with advertising and markets with price competition.
B) public goods and common resources.
C) oligopoly and monopoly.
D) monopolistic competition and oligopoly.
F) B) and C)
Correct Answer

verified
Correct Answer
verified
Multiple Choice
Suppose the point of tangency that characterizes long-run equilibrium for a monopolistically competitive firm occurs at Q1 units of output. This level of output, Q1,
A) exceeds the level of output at which marginal revenue equals marginal cost.
B) exceeds the level of output at which marginal cost equals average total cost.
C) falls short of the level of output at which price equals marginal cost.
D) exceeds the firm's efficient scale of output.
F) None of the above
Correct Answer

verified
Correct Answer
verified
Multiple Choice
In the long run,
A) monopolistically competitive firms earn a higher profit than perfectly competitive firms because monopolistically competitive firms have some monopoly power.
B) monopolistically competitive firms produce a higher output than perfectly competitive firms because competition drives the perfectly competitive firms' output down.
C) both monopolistically competitive and perfectly competitive firms produce where P = MC.
D) both monopolistically competitive and perfectly competitive firms produce where P = ATd.
F) All of the above
Correct Answer

verified
Correct Answer
verified
Multiple Choice
Firm A produces and sells in a market that is characterized by highly differentiated consumer goods. Firm B produces and sells industrial products. Firm C produces and sells an agricultural commodity. Which firm is likely to spend the greatest portion of its total revenue on advertising?
A) firm A
B) firm B
C) firm C
D) There is no reason to believe that any one of the three firms would spend a greater portion of its total revenue on advertising than the other two firms.
F) A) and B)
Correct Answer

verified
Correct Answer
verified
Multiple Choice
A firm has the following cost structure:  If this firm is in a typical monopolistically competitive market, in the long run it will likely produce
A) 8 or fewer units of output.
B) 10 units of output.
C) more than 10 units of output.
D) None of the above are necessarily correct because there is not enough information to tell.
F) A) and D)
Correct Answer

verified
Correct Answer
verified
Multiple Choice
Table 16-3
The following table shows the output produced by each of the top eight firms in four industries as well as the total industry output for those industries.
 -Refer to Table 16-3. What is the concentration ratio for Industry A?
A) approximately 52%
B) approximately 58%
C) approximately 66%
D) approximately 72%
F) A) and D)
Correct Answer

verified
Correct Answer
verified
Multiple Choice
Table 16-1
The following table shows the percentage of output supplied by the top eight firms in four different industries.
 -Refer to Table 16-1. What is the concentration ratio in Industry C?
A) 13%
B) 32%
C) 52%
D) 84%
F) A) and C)
Correct Answer

verified
Correct Answer
verified
Multiple Choice
Figure 16-1 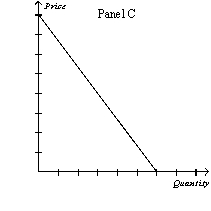
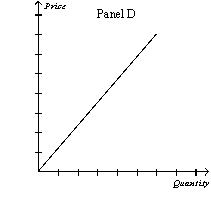
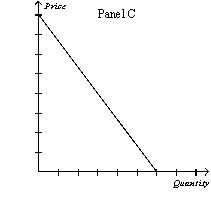
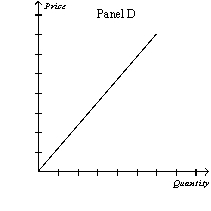 -Refer to Figure 16-1. Which of the following sets of explanations best describes the differences between the graphs above?
A) Panel A: monopolistically competitive firm's demand curve Panel B: monopoly firm's demand curve Panel C: oligopoly firm's demand curve
Panel D: perfectly competitive firm's demand curve
B) Panel A: oligopoly firm's demand curve Panel B: perfectly competitive firm's demand curve
Panel C: monopolistically competitive firm's demand curve
Panel D: supply curve
C) Panel A: perfectly competitive firm's demand curve Panel B: monopolistically competitive firm's demand curve Panel C: monopoly firm's demand curve
Panel D: supply curve
D) Panel A: monopolistically competitive firm's demand curve Panel B: monopoly firm's demand curve Panel C: perfectly competitive firm's demand curve
Panel D: supply curve
F) None of the above
Correct Answer

verified
Correct Answer
verified
Multiple Choice
For the economy as a whole, spending on advertising comprises about what percent of total firm revenue?
A) 0.5
B) 2
C) 10
D) 20
F) B) and C)
Correct Answer

verified
Correct Answer
verified
Short Answer
Figure 16-12 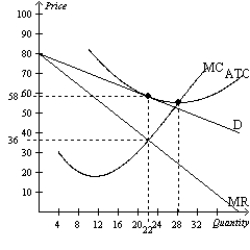 -Refer to Figure 16-12. Does this monopolistically competitive market produce the welfare-maximizing level of output?
Correct Answer

verified
Correct Answer
verified
Multiple Choice
Figure 16-2. The figure is drawn for a monopolistically competitive firm. 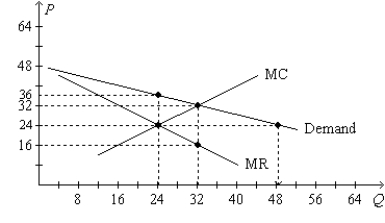 -Refer to Figure 16-2. The firm's profitmaximizing level of output is
A) 16 units.
B) 24 units.
C) 32 units.
D) 48 units.
F) B) and D)
Correct Answer

verified
Correct Answer
verified
Multiple Choice
Critics of markets that are characterized by firms that sell brand name products argue that brand names encourage consumers to pay more for branded products that
A) have elastic demand curves.
B) are very different from generic products.
C) are indistinguishable from generic products.
D) consumer-advocate groups have found to be inferior.
F) None of the above
Correct Answer

verified
Correct Answer
verified
Multiple Choice
Compared to other firms, firms that sell highly differentiated products likely incur significant costs associated with
A) advertising.
B) the product-variety externality.
C) intermediate materials.
D) taxes and regulation.
F) C) and D)
Correct Answer

verified
Correct Answer
verified
True/False
In the long run, monopolistically competitive firms produce where demand equals average total cost.
B) False
Correct Answer

verified
Correct Answer
verified
Multiple Choice
Which of the following goods are not likely to be sold in monopolistically competitive markets?
A) jeans
B) books
C) tap water
D) clocks
F) B) and C)
Correct Answer

verified
Correct Answer
verified
Showing 121 - 140 of 587
Related Exams