A) lower than $9.00
B) $9.00
C) between $9.00 and $10.25
D) $10.25
E) higher than $10.25
G) B) and E)
Correct Answer

verified
Correct Answer
verified
Multiple Choice
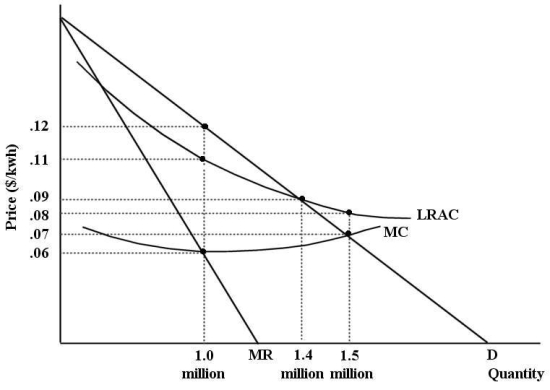
The diagram below shows cost and revenue curves for a natural monopoly producing electricity.Price is dollars per kilowatt hour and quantity is kilowatt hours per day.  FIGURE 12-7
-Refer to Figure 12-7.Suppose this firm is being regulated using a policy of marginal-cost pricing.The resulting price and output would be ________ per kwh and ________ kwh per day.
A) $0.06; 1 million
B) $0.07; 1.5 million
C) $0.08; 1.5 million
D) $0.09; 1.4 million
E) $0.12; 1 million
G) D) and E)
Correct Answer

verified
Correct Answer
verified
Multiple Choice
If average-cost pricing is imposed on a falling-cost natural monopoly,the result will be
A) exit from the industry in the short run.
B) zero economic profit.
C) economic profits.
D) economic losses.
E) losses and exit from the industry in the long run.
G) A) and B)
Correct Answer

verified
Correct Answer
verified
Multiple Choice
Consider the following information for a regional cable television service provider that is a natural monopoly and has a U-shaped long-run average cost curve.(Assume the service provided is basic cable and units are household connections.) - minimum LRAC = $9.00 per month - minimum efficient scale = 2 million units - current output = 1.7 million units - current LRAC = $10.25 per month If this firm is currently being regulated and is following an average-cost pricing policy,the price of service is ________ per month.
A) lower than $9.00
B) $9.00
C) between $9.00 and $10.25
D) $10.25
E) higher than $10.25
G) D) and E)
Correct Answer

verified
Correct Answer
verified
Multiple Choice
A regulated monopoly that faces rising long-run costs (at its current level of output) and which is forced to price its output at average cost will provide
A) less output than what is socially optimal.
B) more output than what is socially optimal.
C) the socially optimal amount of output.
D) more output than what can be absorbed by the market.
E) so little output that there will be a shortage.
G) A) and C)
Correct Answer

verified
Correct Answer
verified
Multiple Choice
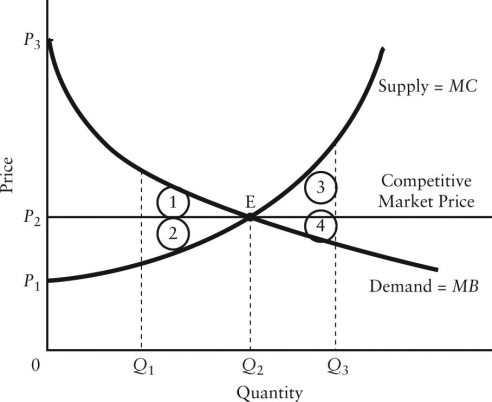
The diagram below shows the demand and supply curves in a perfectly competitive market.  FIGURE 12-5
-Refer to Figure 12-5.If output in this market were Q3,and the price were still P2,the loss in consumer surplus relative to the competitive equilibrium would be illustrated by area
A) 1.
B) 2.
C) 3.
D) 4.
E) 3 + 4.
G) A) and E)
Correct Answer

verified
Correct Answer
verified
Multiple Choice
Consider an industry with three profit-maximizing firms producing identical soccer jerseys.At their current levels of output,Firm A has a MC of $22,Firm B has a MC of $26,and Firm C has a MC of $27.Each firm is minimizing its costs for its given level of output.Which of the following statements is definitely true?
A) Each firm and the industry are productively efficient.
B) Each firm is productively efficient but the industry is not.
C) The industry is productively efficient but each firm is not.
D) Each firm is allocatively efficient but the industry is not.
E) Each firm and the industry are allocatively efficient.
G) A) and C)
Correct Answer

verified
Correct Answer
verified
Multiple Choice
The diagram below shows the demand and supply curves in a perfectly competitive market.  FIGURE 12-5
-Refer to Figure 12-5.Allocative efficiency occurs
A) at output level Q3.
B) at output level Q1.
C) at price P1 and output Q3.
D) at price P2 and output Q2.
E) where the areas 1,2,3,and 4 are maximized.
G) B) and E)
Correct Answer

verified
Correct Answer
verified
Multiple Choice
There has been a trend toward less government regulation and ownership in oligopolistic industries in most industrialized countries since the 1980s.One reason for this is
A) policymakers came to understand that many oligopolistic firms were operating at their minimum efficient scale,thereby producing an efficient outcome.
B) policymakers came to understand that many oligopolistic firms were producing output levels that resulted in allocative efficiency.
C) policymakers realized that they did not have effective tools for promoting efficiency.
D) Canada's Competition Bureau,and similar agencies in other countries were so successful at promoting competition that such regulation is no longer required.
E) domestic firms are now exposed to more international competition due to falling transportation and communication costs.
G) A) and C)
Correct Answer

verified
Correct Answer
verified
Multiple Choice
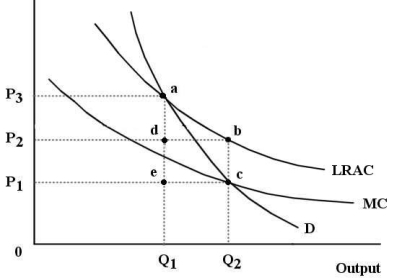
The diagram below shows the market demand curve and the cost curves for a single firm.  FIGURE 12-6
-Refer to Figure 12-6.Suppose this firm is being regulated using a policy of marginal-cost pricing.In this case,
A) allocative efficiency is achieved because profits are maximized.
B) the result is allocatively inefficient because the firm is suffering losses.
C) the result is allocatively inefficient because the firm is earning profits.
D) the result is allocatively inefficient because the marginal cost curve lies below the ATC curve.
E) allocative efficiency is achieved because price equals marginal cost.
G) A) and B)
Correct Answer

verified
Correct Answer
verified
Multiple Choice
In general,the sum of consumer and producer surplus is maximized under the conditions of
A) perfect competition.
B) monopoly.
C) monopolistic competition.
D) oligopoly.
E) any market structure.
G) D) and E)
Correct Answer

verified
Correct Answer
verified
Multiple Choice
Consider three firms,A,B and C,all producing kilos of potatoes (per year) in a perfectly competitive market.The diagrams below show marginal cost curves for each of the three firms.  FIGURE 12-1
-Refer to Figure 12-1.Suppose each of Firms A,B,and C are producing 500 kilos of potatoes.Which of the following statements correctly describes the productive efficiency of this industry?
A) Productive efficiency would be achieved if Firm B produced all the output,since it has the lowest MC for the production of 500 kilos.
B) It is possible to reduce the total cost of the given output by reallocating production among the three firms.
C) The total output of 1500 kilos is the productively efficient output for this industry,so no reallocation is necessary.
D) It is not possible to say whether this industry is productively efficient because we do not know the market price of the product.
E) It is not possible to say whether this industry is productively efficient because we do not know the average costs for each firm.
G) A) and D)
Correct Answer

verified
Correct Answer
verified
Multiple Choice
In principle,a comparison of the long-run equilibrium of competitive and (single-price) monopoly industries leads to the following conclusion:
A) both the competitive industry and the monopoly will allocate resources efficiently.
B) the competitive industry is consistent with allocative efficiency whereas the monopoly is not.
C) neither industry is capable of allocative efficiency.
D) the competitive industry will achieve productive efficiency but the monopoly will not.
E) both the competitive industry and the monopoly will allocate resources inefficiently.
G) C) and E)
Correct Answer

verified
Correct Answer
verified
Multiple Choice
The diagram below shows the market demand curve and the cost curves for a single firm.  FIGURE 12-6
-Refer to Figure 12-6.Suppose the firm is being regulated using a policy of average-cost pricing.The resulting price and output would be
A) P1 and Q2.
B) P1 and Q1.
C) P2 and Q2.
D) P3 and Q1.
E) P3 and Q2.
G) B) and E)
Correct Answer

verified
Correct Answer
verified
Multiple Choice
The Canadian economy is achieving allocative efficiency if
A) price equals average cost in all industries.
B) there are no idle resources in the economy.
C) marginal product is equal for all factors of production.
D) marginal cost equals price in all industries.
E) marginal cost is equalized across industries.
G) D) and E)
Correct Answer

verified
Correct Answer
verified
Multiple Choice
Consider a natural monopoly that has declining LRAC over the entire range of the market demand curve.If it is regulated and required to charge a price that is equal to MC,the resulting level of output is
A) allocatively efficient,and profit is earned.
B) allocatively efficient,but the firm must be paid a subsidy or it will eventually go out of business.
C) less than the allocatively efficient level,and profit is zero.
D) less than the allocatively efficient level,but losses occur.
E) greater than the allocatively efficient level,but losses occur.
G) A) and C)
Correct Answer

verified
Correct Answer
verified
Multiple Choice
The diagram below shows the demand and supply curves in a perfectly competitive market.  FIGURE 12-5
-Refer to Figure 12-5.At the free-market equilibrium,consumer surplus is represented by the area
A) P2P3E.
B) P1P2E.
C) P1P3E.
D) 1 + 2.
E) 1 + 2 + 3 + 4.
G) A) and C)
Correct Answer

verified
Correct Answer
verified
Multiple Choice
The diagram below shows the market demand curve and the cost curves for a single firm.  FIGURE 12-6
-Refer to Figure 12-6.Suppose this firm is being regulated using the policy of marginal-cost pricing.The resulting price and output would be
A) P2 and Q2.
B) P3 and Q1.
C) P1 and Q2.
D) P3 and Q2.
E) P1 and Q1.
G) A) and E)
Correct Answer

verified
Correct Answer
verified
Multiple Choice
Suppose we compare two monopolists with identical cost and demand conditions.Monopolist A charges a single price.Monopolist B engages in price discrimination,charging a different price for different units of the product.Which one of the following statements is correct?
A) B will produce less than A,resulting in a larger deadweight loss.
B) B will generally produce more than A,resulting in less deadweight loss.
C) A will produce less than B,resulting in smaller deadweight loss.
D) A will produce more than B,and there is no deadweight loss.
E) A and B will both produce the same amount.
G) C) and D)
Correct Answer

verified
Correct Answer
verified
Multiple Choice
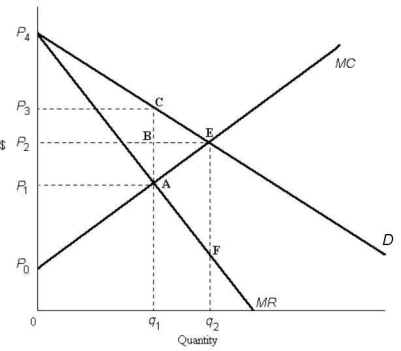
 FIGURE 12-3
-Refer to Figure 12-3.The area representing producer surplus at the monopoly equilibrium is outlined by
A) 0P0Aq1.
B) P0P2BA.
C) P0AP1.
D) P0P3CA.
E) 0P3Cq1.
G) A) and C)
Correct Answer

verified
Correct Answer
verified
Showing 21 - 40 of 123
Related Exams