A) a decrease in the price of fertilizer
B) an increase in the price of irrigation equipment
C) an increase in consumer incomes
D) a change in consumer tastes in favour of cornbread
F) None of the above
Correct Answer

verified
Correct Answer
verified
Multiple Choice
If products C and D are close substitutes,an increase in the price of C will:
A) tend to cause the price of D to fall.
B) shift the demand curve of C to the left and the demand curve of D to the right.
C) shift the demand curve of D to the right.
D) shift the demand curves of both products to the right.
F) B) and C)
Correct Answer

verified
Correct Answer
verified
Multiple Choice
What combination of changes in supply and demand would most likely increase the equilibrium price?
A) when supply increases and demand decreases
B) when supply decreases and demand increases
C) when supply decreases and demand decreases
D) when supply increases and demand increases
F) A) and B)
Correct Answer

verified
Correct Answer
verified
Multiple Choice
If consumer incomes increase,the demand for product X:
A) will necessarily remain unchanged.
B) may shift either to the right or left.
C) will necessarily shift to the right.
D) will necessarily shift to the left.
F) A) and B)
Correct Answer

verified
Correct Answer
verified
True/False
An increase in the supply of product X,with demand held constant,will increase the price of product X.
B) False
Correct Answer

verified
Correct Answer
verified
Multiple Choice
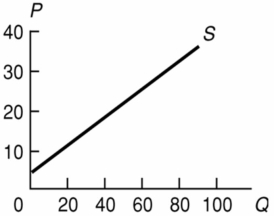
 -The equation for the supply curve in the above diagram:
A) is P = 5 + 1/3Q.
B) is P = 5 + 2Q.
C) is P = 5 + 3Q.
D) is P = 5 - 3Q.
F) A) and C)
Correct Answer

verified
Correct Answer
verified
Multiple Choice
If an effective legal ceiling is imposed on credit card interest rates:
A) such credit would be less readily available.
B) annual credit card fees would fall.
C) the product prices charged by merchants who issue credit cards would fall.
D) more credit cards will be issued.
F) A) and D)
Correct Answer

verified
Correct Answer
verified
Multiple Choice
One can say with certainty that equilibrium price will decline when supply:
A) and demand both decrease.
B) increases and demand decreases.
C) decreases and demand increases.
D) and demand both increase.
F) A) and C)
Correct Answer

verified
Correct Answer
verified
Multiple Choice
If demand for a good decreases and supply remains constant,equilibrium price:
A) and quantity will both increase.
B) will increase,and equilibrium quantity will decrease.
C) will decrease,and equilibrium quantity will increase.
D) and quantity will both decrease.
F) C) and D)
Correct Answer

verified
Correct Answer
verified
Multiple Choice
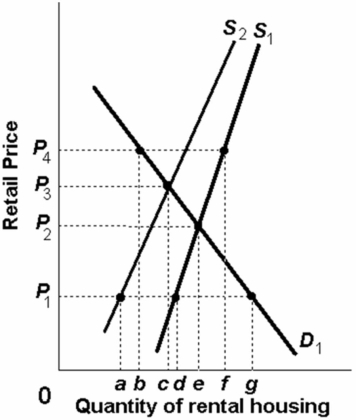
 -Refer to the above graph,which shows the supply and demand for rental housing in a city.Given the demand D1 and the supply S1 for rental housing,if the government established rent controls in the city at below the equilibrium,then the price of housing would most likely be at:
A) P1 and there would be a shortage of rental housing.
B) P2 and there would be a shortage of rental housing.
C) P3 and there would be a surplus of rental housing.
D) P4 and there would be a surplus of rental housing.
F) A) and C)
Correct Answer

verified
Correct Answer
verified
Multiple Choice
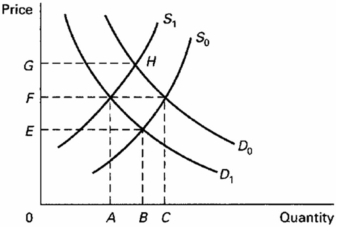
 -Refer to the above diagram,which shows demand and supply conditions in the competitive market for product X.If the initial demand and supply curves are D0 and S0,equilibrium price and quantity will be:
A) 0F and 0C respectively.
B) 0G and 0B respectively.
C) 0F and 0A respectively.
D) 0E and 0B respectively.
F) B) and D)
Correct Answer

verified
Correct Answer
verified
Multiple Choice
The horizontal axis of a graph which shows a market demand curve indicates the:
A) prices at which various levels of output can be sold.
B) number of consumers who are in the market for this product.
C) various quantities of output at which the market will be cleared.
D) quantities which consumers will be willing and able to buy at various prices.
F) B) and C)
Correct Answer

verified
Correct Answer
verified
Multiple Choice
A firm's supply curve is upward sloping because:
A) the expansion of production necessitates the use of qualitatively inferior techniques.
B) mass production economies are associated with larger levels of output.
C) consumers envision a positive relationship between price and quality.
D) beyond some point the production costs of additional units of output will rise.
F) A) and D)
Correct Answer

verified
Correct Answer
verified
Multiple Choice
If product Y is an inferior good,an increase in consumer incomes will:
A) result in a surplus of product Y.
B) not affect the sales of product Y.
C) shift the demand curve for product Y to the left.
D) shift the demand curve for product Y to the right.
F) B) and C)
Correct Answer

verified
Correct Answer
verified
Multiple Choice
Economists use the term "demand" as:
A) a particular price-quantity combination on a stable demand curve.
B) the total amount spent on a particular commodity over a stipulated time period.
C) an upsloping line on a graph which relates consumer purchases and product price.
D) a schedule of various combinations of market prices and amounts demanded.
F) All of the above
Correct Answer

verified
Correct Answer
verified
Multiple Choice
Assuming conventional supply and demand curves,changes in the determinants of supply and demand will:
A) in all likelihood alter both equilibrium price and quantity.
B) alter equilibrium quantity,but not equilibrium price.
C) alter equilibrium price,but not equilibrium quantity.
D) have no effect upon equilibrium price or quantity.
F) C) and D)
Correct Answer

verified
Correct Answer
verified
Multiple Choice
A decrease in the price of gasoline will:
A) cause the demand curve for gas powered cars to become vertical.
B) shift the demand curve for gas powered cars to the right.
C) shift the demand curve for gas powered cars to the left.
D) not affect the demand for gas powered cars.
F) A) and B)
Correct Answer

verified
Correct Answer
verified
Multiple Choice
Given a downward sloping demand curve and an upward sloping supply curve for product X,an increase in the price of a substitute good (in consumption) will:
A) increase equilibrium price and quantity of X.
B) decrease equilibrium price and quantity of X.
C) increase equilibrium price and decrease equilibrium quantity of X.
D) decrease equilibrium price and increase equilibrium quantity of X.
F) A) and B)
Correct Answer

verified
Correct Answer
verified
Multiple Choice
If an increase in consumer incomes causes the demand curve for product Z to shift to the left,then it can be said that product Z is a(n) :
A) normal good.
B) luxury good.
C) inferior good.
D) inexpensive good.
F) B) and D)
Correct Answer

verified
Correct Answer
verified
Multiple Choice
The demand for commodity X is represented by the equation P = 10 - 0.2Q and supply by the equation P = 2 + 0.2Q. -Refer to the above information.The equilibrium quantity is:
A) 10
B) 20
C) 15
D) 30
F) B) and D)
Correct Answer

verified
Correct Answer
verified
Showing 221 - 240 of 284
Related Exams