A) the maximum cost of producing any level of output when all the factors are fixed.
B) the lowest cost of producing any level of output when all the factors are variable.
C) the maximum cost of producing any level of output when all the factors are variable.
D) the lowest cost of producing any level of output when all the factors are fixed.
E) the lowest cost of producing any level of output when at least one factor is fixed.
G) All of the above
Correct Answer

verified
Correct Answer
verified
Multiple Choice
The table given below shows the total cost of producing different units of the output by a competitive firm.Table 8.4
 -Refer to Table 8.4. At 4 units of output,
A) AFC is $6.25 and AVC is $10.
B) AFC is $6.25 and AVC is $40.
C) AFC is $40 and AVC is $6.25.
D) AFC is $25 and AVC is $40.
E) AFC and AVC cannot be determined for the firm in question.
G) B) and E)
Correct Answer

verified
Correct Answer
verified
Multiple Choice
The table given below shows the average total cost of production of a firm at different levels of the output.Table 8.5
 -In Table 8.5, if the total fixed cost is $3, what is the total variable cost of producing 5 units?
A) $38
B) $32
C) $3
D) $8
E) Cannot be determined from the information given.
G) A) and C)
Correct Answer

verified
Correct Answer
verified
Multiple Choice
The below figure shows the various combinations of the goods X and Y that yield different levels of utility.Figure 7.3
 -At its minimum point, the average-total-cost curve is intersected by the:
A) average fixed cost curve.
B) average variable cost curve.
C) total fixed cost curve.
D) total variable cost curve.
E) marginal cost curve.
G) B) and C)
Correct Answer

verified
Correct Answer
verified
True/False
The figure given below shows three Short Run Average Total Cost (SRATC) curves and the Long Run Average Total Cost (LRATC) curve of a firm.Figure 8.3
 -If short-run average total costs are rising in the oil tanker industry, it implies that economies of scale exist in that industry.
B) False
Correct Answer

verified
Correct Answer
verified
Multiple Choice
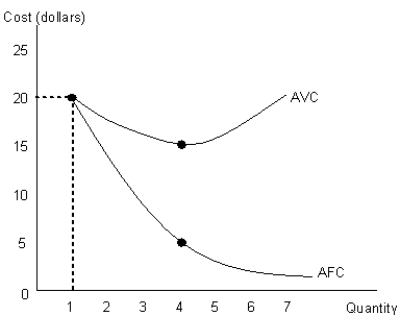
The figure given below shows the average fixed cost (AFC) and the average variable cost (AVC) curves of a competitive firm.Figure 8.1
 -Refer to Figure 8.1. Compute the total cost of producing 4 units of the output.
A) $64
B) $72
C) $80
D) $84
E) $90
G) A) and B)
Correct Answer

verified
Correct Answer
verified
Multiple Choice
The table given below shows the average total cost of production of a firm at different levels of the output.Table 8.5
 -If a firm doubles its resources and generates an output level which is more than double, it is said to be experiencing:
A) economic fluctuations.
B) recession.
C) diseconomies of scale.
D) increasing marginal returns to a factor.
E) economies of scale.
G) A) and C)
Correct Answer

verified
Correct Answer
verified
Multiple Choice
The below figure shows the various combinations of the goods X and Y that yield different levels of utility.Figure 7.3
 -Fixed costs are costs paid for:
A) medical reimbursements and health insurance of workers.
B) obsolete plant and equipment not used anymore.
C) plant and equipment in the long run.
D) hiring temporary workers.
E) resources that do not change with changes in output.
G) C) and D)
Correct Answer

verified
Correct Answer
verified
Multiple Choice
The below figure shows the various combinations of the goods X and Y that yield different levels of utility.Figure 7.3
 -"As I add more workers to the factory line, the additional output produced by each additional worker seems to decline. Eventually, the workers just get in each others' way." This statement by a factory supervisor refers to the law of:
A) comparative advantage.
B) demand.
C) supply.
D) increasing returns to scale.
E) diminishing marginal returns.
G) A) and B)
Correct Answer

verified
Correct Answer
verified
Multiple Choice
The table given below shows the average total cost of production of a firm at different levels of the output.Table 8.5
 -In Table 8.5, the marginal cost of producing the third unit of output is:
A) $7.
B) $8.
C) $3.
D) $4.
E) $6.
G) A) and D)
Correct Answer

verified
Correct Answer
verified
Multiple Choice
The table given below shows the total fixed and variable costs of a firm.Table 8.3
 -Refer to Table 8.3. At what level of output does the average total cost starts increasing?
A) 1 unit
B) 6 units
C) 5 units
D) 7 units
E) 4 units
G) A) and E)
Correct Answer

verified
Correct Answer
verified
Multiple Choice
The following table shows the cost of producing different units of ball point pens by a firm.Table 8.1
 -Refer to Table 8.1. What is the marginal cost of producing the fifth unit?
A) $4
B) $6
C) $8
D) $2
E) $10
G) B) and E)
Correct Answer

verified
Correct Answer
verified
True/False
The figure given below shows three Short Run Average Total Cost (SRATC) curves and the Long Run Average Total Cost (LRATC) curve of a firm.Figure 8.3
 -In the long run, the producer can change the entire plant size to produce a certain level of the output.
B) False
Correct Answer

verified
Correct Answer
verified
True/False
The figure given below shows three Short Run Average Total Cost (SRATC) curves and the Long Run Average Total Cost (LRATC) curve of a firm.Figure 8.3
 -When a firm grows to such an extent that it is unable to coordinate between its employees properly it is likely to experience economies of scale.
B) False
Correct Answer

verified
Correct Answer
verified
Multiple Choice
The below figure shows the various combinations of the goods X and Y that yield different levels of utility.Figure 7.3
 -If labor is the only variable input, an increase in the quantity of labor:
A) does not have any effect on the quantity of output.
B) causes the output to increase initially at a diminishing rate and then at an increasing rate.
C) causes the output to increase at a constant rate till the last worker is hired.
D) causes the output to increase initially at an increasing rate and then at a decreasing rate.
E) causes the output to decrease at a constant rate till the last worker is hired.
G) A) and E)
Correct Answer

verified
Correct Answer
verified
Multiple Choice
The figure given below shows three Short Run Average Total Cost (SRATC) curves and the Long Run Average Total Cost (LRATC) curve of a firm.Figure 8.3
 -If a firm experiences constant returns to scale throughout:
A) the long-run average-total-cost curve is negatively sloped.
B) the short-run average-total-cost curves are tangential to the long-run average-total-cost curve at a point on their positively sloped portion.
C) the short-run average-total-cost curves are tangential to the long-run average-total-cost curve at their minimum points.
D) the short-run average-total-cost curves are tangential to the long-run average-total-cost curve at a point on their negatively sloped portion.
E) the long-run average-total-cost curve is positively sloped.
G) A) and D)
Correct Answer

verified
Correct Answer
verified
Multiple Choice
The table below shows the total cost of producing different units of a commodity.Table 8.2
 -Refer to Table 8.2. If the production of 2 extra units (units 11 and 12) increases total cost by $162, then:
A) the marginal cost of the twelfth unit will be $162.
B) the total cost of producing 12 units will be $894.
C) the average variable cost of producing 11 units is $732.
D) the average total cost of producing 12 units is $61.
E) the marginal cost of the thirteenth unit will be $0.
G) A) and E)
Correct Answer

verified
Correct Answer
verified
Multiple Choice
The below figure shows the various combinations of the goods X and Y that yield different levels of utility.Figure 7.3
 -If a firm is experiencing diminishing returns to a variable input, then:
A) it must be hiring less-productive units of the variable resource.
B) it must be experiencing diseconomies of scale.
C) the marginal physical product of the variable input must be decreasing.
D) the average physical product of the variable input must be decreasing.
E) its total product must be decreasing.
G) A) and C)
Correct Answer

verified
Correct Answer
verified
Multiple Choice
The figure given below shows three Short Run Average Total Cost (SRATC) curves and the Long Run Average Total Cost (LRATC) curve of a firm.Figure 8.3
 -As the confectionary, Mrs. Fields' Cookies, gained popularity in California and decided to expand its operations to Utah, it was able to achieve economies of scale. This means that:
A) property taxes were lower in its new location in Utah.
B) transport and communication systems were more developed in Utah.
C) wages were higher in Utah compared to California.
D) expansion of output and firm size led to specialization among the workers.
E) government policies were more favorable in Utah.
G) A) and B)
Correct Answer

verified
Correct Answer
verified
Multiple Choice
The table given below shows the average total cost of production of a firm at different levels of the output.Table 8.5
 -In the long run, the total variable cost of a firm:
A) is equal to its total fixed cost.
B) is equal to its total cost.
C) is equal to its average fixed cost.
D) is more than its total fixed cost.
E) is less than its total cost.
G) All of the above
Correct Answer

verified
Correct Answer
verified
Showing 21 - 40 of 105
Related Exams